Donor-Driven
Case Study Snapshot

2015-2021
Performance Review and Analysis
Important Disclaimer
While MarketSmart has attempted to make the data and analysis in this report as accurate as possible, the findings herein are dependent on the completeness and accuracy of the data and information furnished by your supporters (found in our Engagement Fundraising System) and the data furnished by you, the customer. Accordingly, MarketSmart is not responsible for any errors or omissions in the report or for the results of using (or any reliance on) the information in the report.
Additionally, our analysis reflects MarketSmart’s reasoned opinion based on the aforementioned information and data as well as certain assumptions and judgments we have made, including those stated in this report.
This report is furnished “as is,” without any representations, warranties or guarantees, whether express or implied, including any warranties of completeness or accuracy. The opinions expressed in this report are solely those of MarketSmart.
Data Summary
-
The dataset represented is Benedictine College’s entire donor file from 2010 to 2020
-
Segments represented within the file are
-
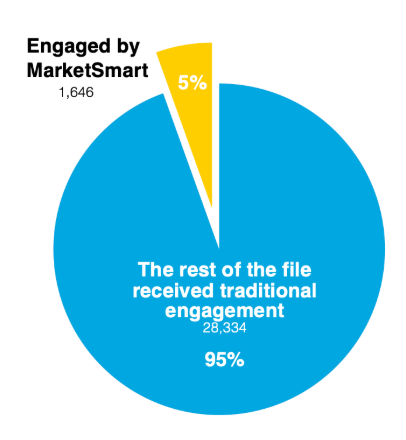
Donors engaged by MarketSmart who submitted forms and interacted with offers (represented in yellow)
-
Donors engaged by MarketSmart who did not submit forms or interact with offers (represented in blue)
-
Donors not engaged by MarketSmart (represented in blue)
-
-
Records that could not be matched to the engagement data are considered ‘Not Engaged by MarketSmart.’
Important Note:
In an effort to normalize the data (reduce skewing), we removed the top ½% (.005) of donors making the largest gifts (approximately 20 per year) thereby eliminating donations of $100,000 or more.

Total Giving
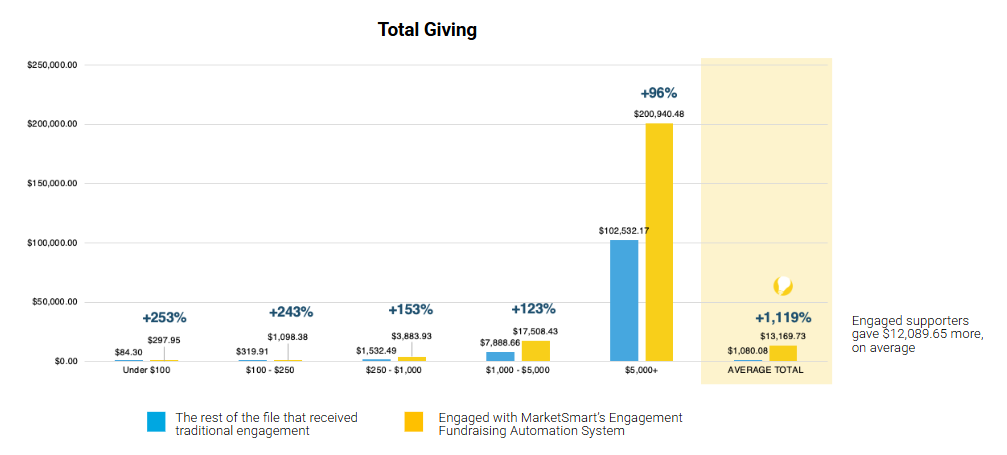
At every giving level, individuals engaged by MarketSmart’s Engagement Fundraising System gave more (+1,119% more on average) than the rest of the file.
Upgrade $
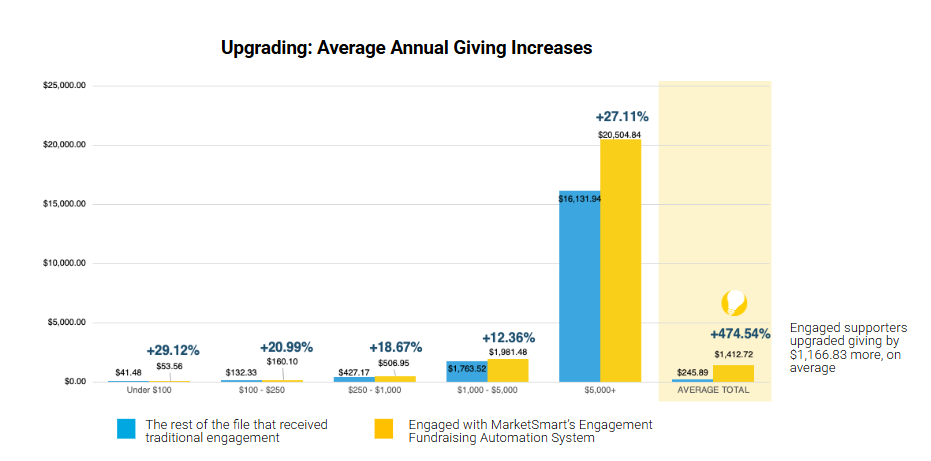
At every giving level, individuals engaged by MarketSmart’s Engagement Fundraising System increased their giving by more than the rest of the file (+474.54% more on average).
Upgrade %
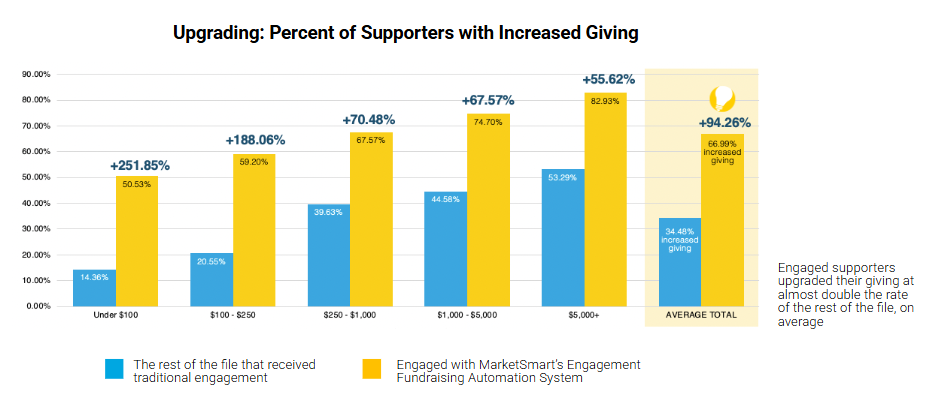
At every giving level, individuals engaged by MarketSmart’s Engagement Fundraising System upgraded at greater rates (+94.26% greater on average) when compared with the rest of the file.
Multi-Year Retention
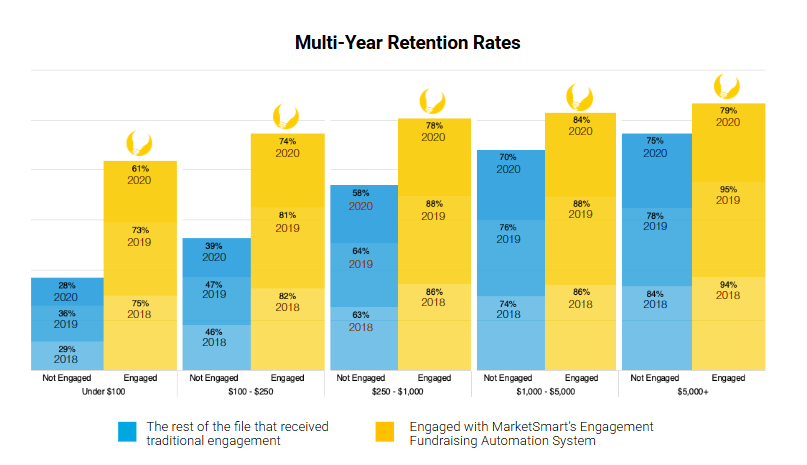
At every giving level and in every year, individuals engaged by MarketSmart’s Engagement Fundraising System retained at greater rates than individuals in the rest of the file.
Reactivation %
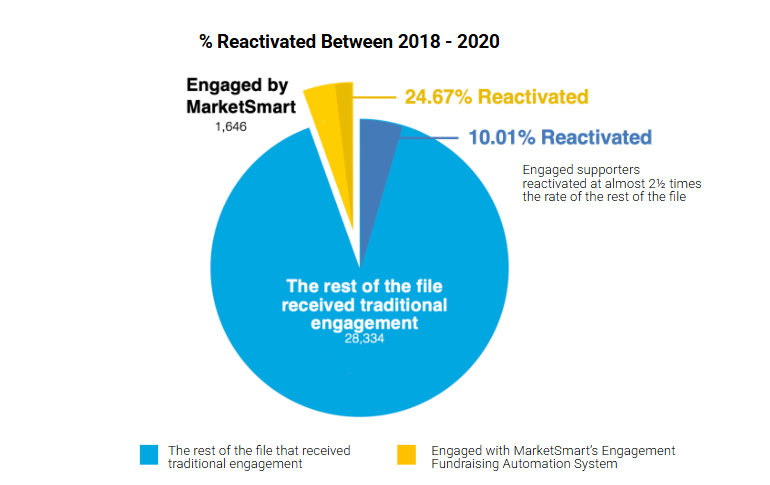
Individuals engaged by MarketSmart’s Engagement Fundraising System reactivated their giving at a higher percentage compared to the individuals in the rest of the file.
Reactivation $
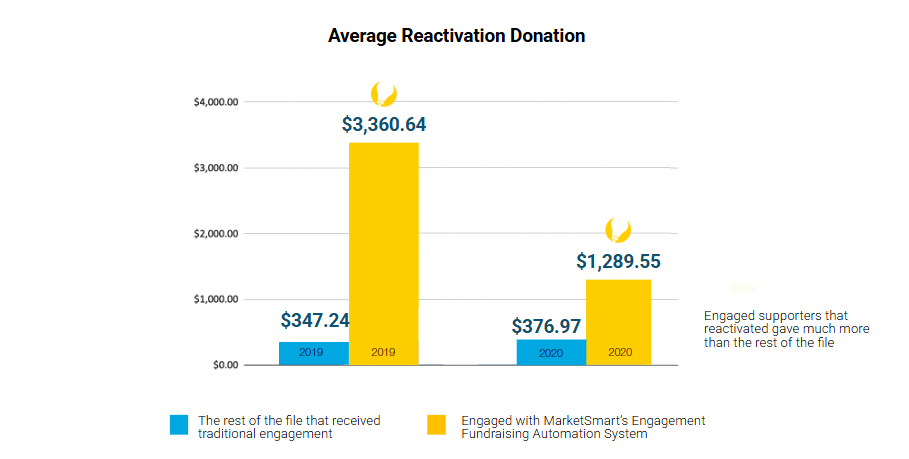
Individuals engaged by MarketSmart’s Engagement Fundraising System that reactivated their giving did so while giving substantially more than individuals in the rest of the file.
Pipeline As of3/25/2021
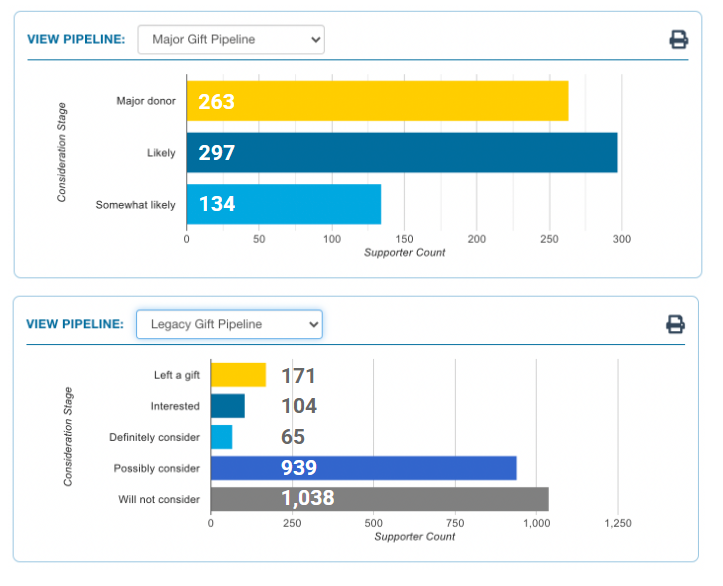
Pipeline As of3/25/2021
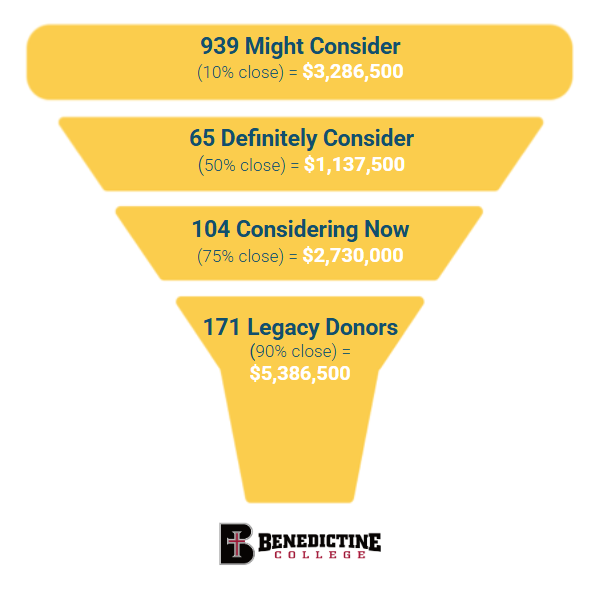
Major Giving Potential
This potential major gift revenue is based on an estimated $10,000 major gift amount and conservative close rates.
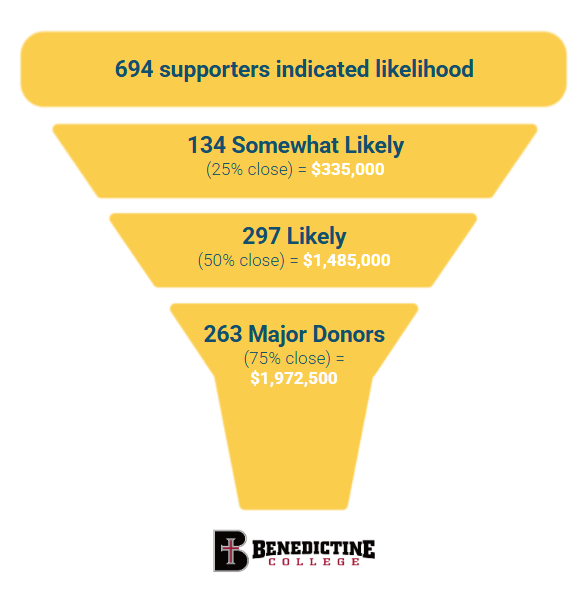
Pipeline As of3/25/2021
Legacy Giving Potential
It is generally accepted that the average bequest amount in the US and Canada is around $35,000. Some sectors like healthcare, arts & culture, and higher education report average planned gifts 3 to 4 times that amount.*
One supporter documented their gift online and disclosed it’s value at $250,000.
Return On Investment Projections
Revenue From Engaged Supporters $21,677,376
Does not include top .05% of donors (outliers)
Engaged Pipeline (Potential Revenue): $16,333,000
Potential major giving funnel revenues if closed = $3,792,500
Potential planned giving funnel revenues if closed = $12,540,500
Total Revenue From Engaged Supporters + Pipeline = $38,010,376
Total investment in MarketSmart (2015 - March 2021) = $374,883
Expected Return On Investment = $101.40 : $1
$101.40 projected to be returned for every $1 invested.
Important note: The largest gifts were not included
In an effort to normalize the data (reduce skewing), we removed the top ½% (.005) of donors making the largest gifts (approximately 20 per year) thereby eliminating donations of $100,000 or more.
Predictive Model Data Analysis
Data Analyzed
Approximately 44,000 distinct Constituent IDs were supplied in the data. We were able to match approximately 11,500 IDs (26.14%) to the donor giving data (2010-2020).
In order to maintain consistency, once again we dropped the top 0.5% of donors with the highest average annual giving amounts in order to eliminate the outliers and normalize the data.
Predictive Model Data Analysis
Planned Gift Likelihood Scores and their Correlation to Disclosures
Disclosure Analysis
Regarding planned gift likelihood, we first reviewed the 171 supporters who stated in MarketSmart’s survey that they had “already included a gift to Benedictine College in their will, trust, or by beneficiary designation.” 148 out of the 171 donors who disclosed their legacy gift intentions were included in the supplied predictive model data.
Since the average planned gift likelihood score for all 44,000+ records was 504 and the average score for the 148 donors that disclosed their legacy gift intentions was 716 (42% higher than 504), our analysis found that the scores were predictive of planned gift likelihood.

Predictive Model Data Analysis
Regarding Correlation Coefficents
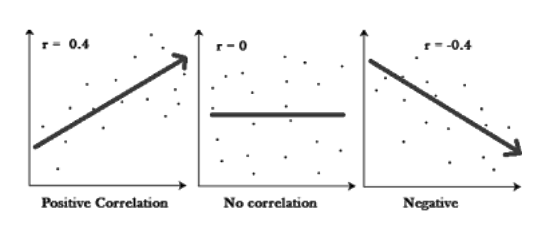
Correlation coefficients can range from -1.0 to 1.0 with values closer to 1 (or -1) indicating the strongest positive or negative correlation. A value of 0.4 or above would appear to indicate a strong correlation and 0.7 or above would appear to indicate a very strong correlation.

Predictive Model Data Analysis
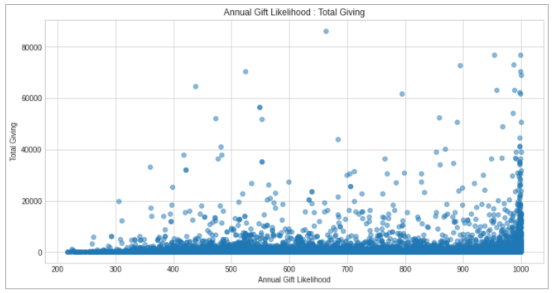
Annual Gift Likelihood Scores and their Correlation to Giving Results
0.15 Correlation
The correlation between the supplied annual gift likelihood scores and average annual giving appears to be very weak.

0.22 Correlation
The correlation between the supplied annual gift likelihood scores and total giving appears to be very weak.
.40 or greater reflects a positive correlation
Predictive Model Data Analysis
Major Gift Likelihood Scores and their Correlation to Giving Results
0.13 Correlation
The correlation between the supplied major gift likelihood scores and average annual giving appears to be very weak.

0.21 Correlation
The correlation between the supplied major gift likelihood scores and total giving appears to be very weak.
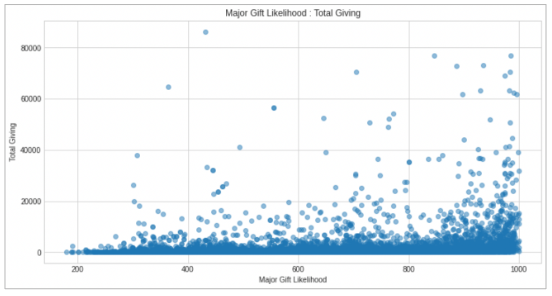
.40 or greater reflects a positive correlation

Predictive Model Data Analysis
Planned Gift Likelihood Scores and their Correlation to Giving Results
0.04 Correlation
The correlation between the supplied planned gift likelihood scores and average annual giving appears to be negligible.

0.11 Correlation
The correlation between the supplied planned gift likelihood scores and total giving appears to be negligible.
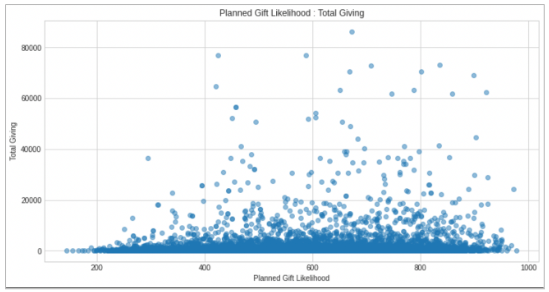
.40 or greater reflects a positive correlation

Predictive Model Data Analysis
Analysis
With regards to annual giving and total giving, our analysis found negligible to very weak (at best) positive correlation between the supplied predictive model likelihood scores and the donation data supplied to us. Thus, in our opinion, the scores appear to be not predictive of annual giving and total giving likelihood.
Note: Please see the important disclaimer above.

imarketsmart.com
Donor-driven major, mid-level and legacy
gift marketing guaranteed to deliver.